Description

Ben Collins – Data Analysis with Google Sheets
Learn how to make data-driven decisions in Google Sheets and transform your business
Are you drowning in data, but not using it to make better decisions?
Do you run a small business and want to use your data to inform your strategy?
Has your business migrated from Excel to Google Sheets, and you’re looking to further your skills?
Learn how to use Google Sheets to make data-driven decisions.
This course will set you up to:
- Understand and describe what your data tells you
- Predict what things might look like in the future
- Understand your customers to better serve them
- Discover what factors affect your business
- Best practices for doing all of this…
- …and much, much more!
Use your data instead of “gut” feel to put your business on the right path.
Each lesson is taught through bite-sized, action-oriented 5 – 10 minute-long videos, covering practical techniques you can apply to your own business.
Working with real-world examples, including example datasets from industries like sales, marketing, real-estate and social media, you’ll learn how to make the most of your business data today.
Now you can learn data analysis, using the same techniques and best practices I’ve spent the past 15 years learning.
This course will teach you the key foundational techniques in data analysis, even if you’re new to this topic.
As part of this course development, I had a group of people test-drive the course. This is what they had to say about it:

“I was really excited by the idea of using an application I was familiar with, Google Sheets, to complete data analysis that had seemed so challenging and foreign before.
People like me, who are not data scientists, and want an easy entry level way to start playing with data, would benefit from this course.
I absolutely love this course!“
– Geordie Frost, Bang Digital

“I wanted to learn more about what I can do with Google Sheets to get an idea about how my agency can benefit. My SEO company uses Google almost entirely for all our project management, etc.
I take every course from Ben Collins. I’m always looking to up my data game. If you can understand your Data you can make correct decisions about your business and *almost* guarantee success.“
– Devin Schumacher, The Search Marketing Company

“Weekly, I face datasets I have to analyse and deliver insights. This new knowledge will help me get more insights from my data.
Since I’ve already done three of Ben’s previous courses, which were super useful, I knew it would be worth enrolling in this “analytical course”. I was right :)”
– Jaume Fàbrega, Trekksoft
I’ll tell you more about the course in a moment…
…but first let me reassure you:
I’ve made just about every mistake in the book
Prior to consulting and creating courses, I worked as a forensic accountant, doing investigations into sanctions violations at large financial organizations.
We used Excel and SQL to manage our project data — hundreds of thousands of transactions that we would analyze for the legal team.
There was one time I working on the master Excel dataset for a few days, but the unique identifier column was hidden. These unique IDs were therefore omitted from all the filters and sorts.
I had a total panic when I realized that the ID numbers were now totally out of sync with the related data, and there was no way for anyone to now reference the data.
(Thankfully, I was able to create a new unique identifier based on the data, and use that to retrieve the IDs from an older copy of the dataset, where they weren’t messed up.)
I learnt the valuable lesson of being careful with my data and keeping a good audit trail — something we discuss throughout this course.
It was also around this time that I realized how valuable solid data and spreadsheet skills were, and I’ve taken every opportunity to further my skills since then.
Fast forward to today

Today I create online courses and write about working with data, with a particular focus on how-to articles for learning data analytics and building dashboards, using Google Sheets, Apps Script and Data Studio.
Since mid-2015, I’ve been working as a freelance spreadsheet developer, data consultant and instructor.
I’ve taught data analysis and visualization courses and workshops at General Assembly’s Washington, D.C., campus and privately for clients.
The missing piece
This data analysis course is my third premium course.
It fills the gap between the data cleaning course and the dashboard reporting courses, which hundreds of students have taken, to cover the whole data analysis process:

Earlier this year I ran a couple of webinars about the QUERY function (which features in this data analysis course), and here’s what some folks were saying about my other Google Sheets training courses:

Josh wanted to be a data analyst, so he took a data analysis course to accelerate his career
Josh was one of my students in the first Data Analysis class I taught for General Assembly in Washington, DC. (In that course, I taught data analysis fundamentals with Excel, but the topics were similar to what I now teach in Google Sheets.)
Today, less than 3 years later, he has a masters degree in predictive analytics and works as a fully fledged data scientist. Wow!
Anyway, I won’t say anymore, I’ll let Josh tell his story.
About the course
If you want to…
- Describe and understand your datasets
- Test your hunches and confirm or disprove what you believe your data is telling you
- See how to convince your boss of your ideas backed up with rigorous results
- Predict outcomes based on your existing data
- Understand trends in your data over time, so you can identify successful events
- Understand your customers better, to better serve them
…then Data Analysis with Google Sheets is for you.
Inside this course I share all the knowledge I’ve built up over the past 15 years working with data in spreadsheets.
I’ve packaged it all into a series of simple, bite-size video lessons, complete with Google Sheet templates, that anyone can follow.
Enroll now to get:
✅ Actionable, bite-size video lessons teaching key data analysis topics
✅ All raw datasets for you to follow along
✅ All solution files for your own use
✅ Access to the private course Facebook group for Q&A
✅ Certificate upon completion
Ok data geeks! Here are the details for every module you get in this class:
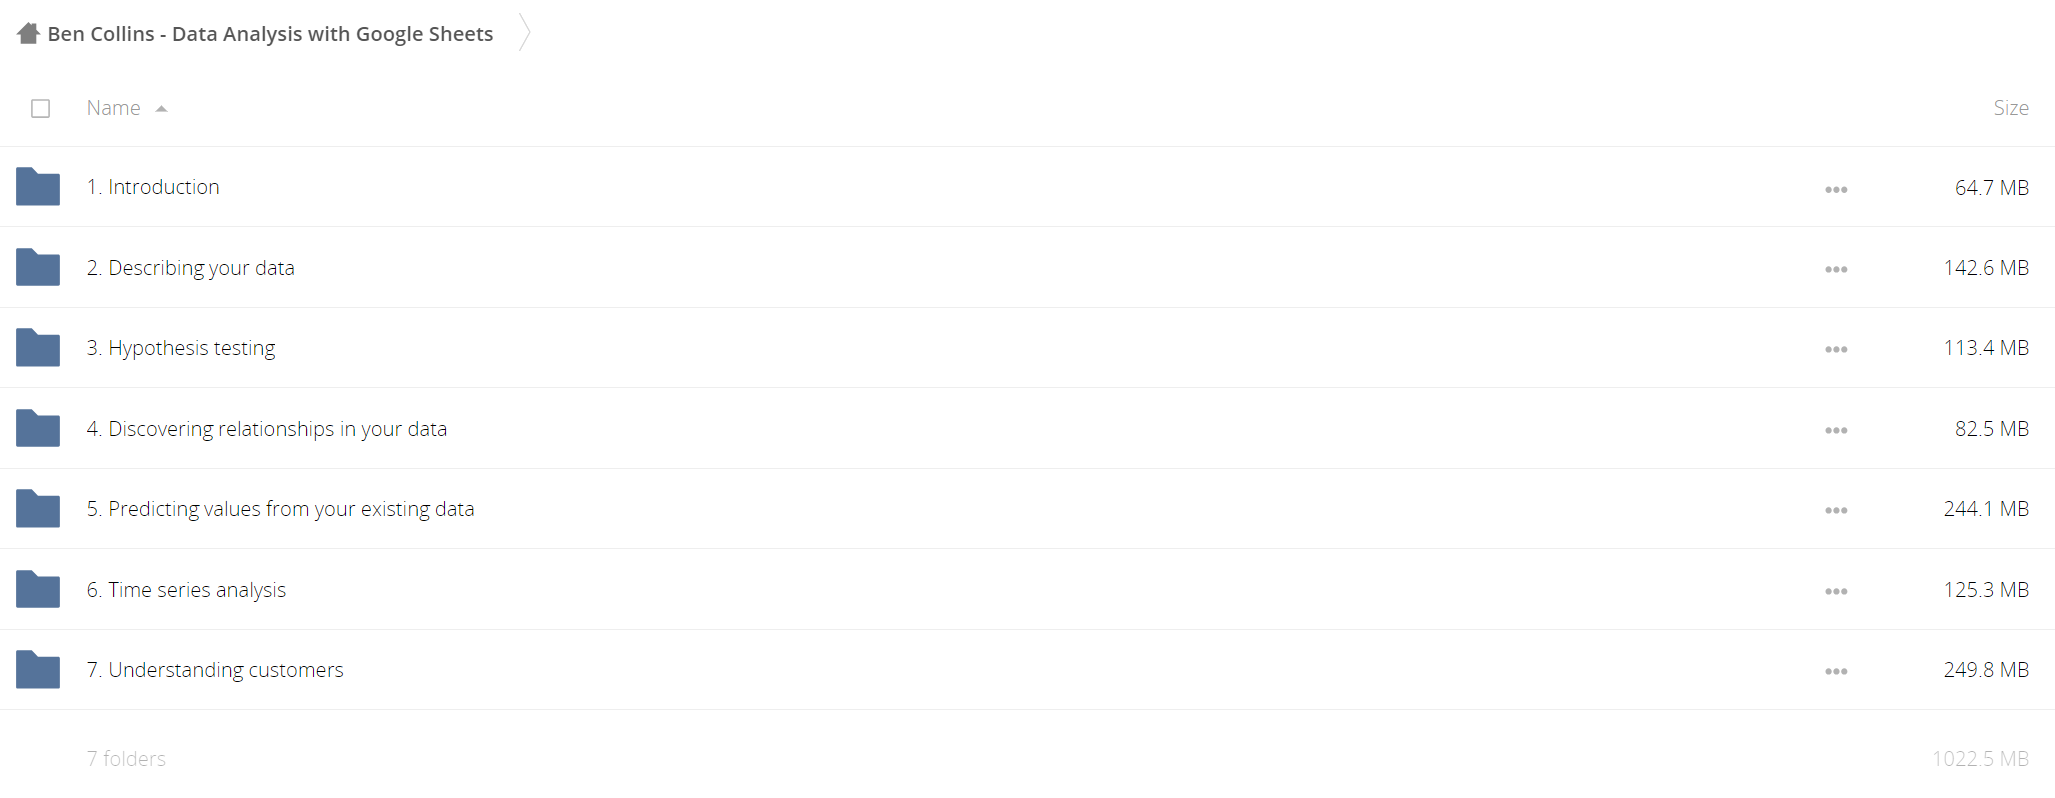
? 7 modules | 45 videos | 20 templates
Each video breaks down a particular topic in data analysis and Google Sheets, and allows for quick referencing in the future. You can watch them in any order you like, spread them over a few weeks or months, or even binge watch them all today if you like!
Module 1: Introduction
- What is data analysis
- A framework for approaching data analysis problems
- Best practices in Google Sheets
- Glossary of Data Terms
- Guide to the most useful keyboard shortcuts in Google Sheets, for Macs, PCs and Chromebooks
Module 2: Describing your data — Learn to:
- Do exploratory data analysis
- Determine the key measures of a dataset
- Present these findings to colleagues
Module 3: How different is your data? Learn to:
- Test, test, test!
- Formulate and test hypotheses about your data…
- …so that you can confidently talk about your data (and know what you’re saying is statistically significant)
- Run a number of different statistical tests so you can move beyond the “gut feel” approach to data
Module 4: Discovering relationships in your data — Learn to:
- Determine if two variables are correlated
- Calculate a variety of correlation metrics
- Avoid a variety of common mistakes
Module 5: Predicting values — Learn to:
- Build models using regression so that you can make predictions based on your existing data
- Test your models so you’ll know if they’re any good
- Build a spreadsheet interface running your regression model in the background
Module 6: Time series analysis — Learn to:
- Use a variety of ways to smooth your time series data to understand underlying trends
- Use the SOLVER add-on to optimize models
- Test your models to choose the most appropriate one
Module 7: Customer analysis — Learn To:
- Calculate customer lifetime value and find your most valuable cohorts
- Calculate your churn and retention rates to identify where customers drop off
- Draw retention curves to present results to your colleagues/bosses/clients
Plus, you’ll also get the following additional resources:
? Templates!
At the beginning of each module are templates with the raw datasets and solution files, available for your use, saving you hours of time.
Here’s a sample of what you can expect with the templates:

There are three templates for each chapter:
- The raw dataset
- The solution
- Summary reports, featuring Google Slides, Google Docs and Email examples
These resources alone will save you hours and hours of valuable time.
? Access to the private course Facebook group
Your enrollment is backed up with support.
There’s a private Facebook group for students, where you can ask questions, share your insights and knowledge, share your wins, and connect with other students.
I’ll be hanging out there to answer your questions.

? Lifetime access to the course
Your enrollment in Data Analysis with Google Sheets comes with lifetime access to the course material.
That way you can take a break from the material if you’re out of town, on vacation, or just swamped for a few days.
Interruptions happen, and your course videos will ALWAYS be here for you when you’re ready. This lifetime access also includes all future updates and upgrades at no extra charge.
This is my way of ensuring that Data Analysis with Google Sheets remains an excellent long-term investment for you and your business.
? Certificate of Completion
Want to show off your newly acquired skills?
You’ll automatically get a certificate upon completing the course, which you can share or post on Linkedin.


12 reviews for Ben Collins – Data Analysis with Google Sheets
There are no reviews yet.